Logs
Engine collects information provided by various resources and activities about their state changes, operations and more. This information is displayed in the "Logs" tab of the respective resource and collectively under Workspace Logs.
In Engine, the following provide logs:
- Executions
- Git configs
- Sync configs
- Users
- Webhooks
- Workspaces
Logs are dynamically updated, so you can follow along even during an execution.
Log Levels
Logs are colour coded so you can easily distinguish between their severity. Here are the different levels and their respective colours:
- Info - no colour
- Warning - yellow
- Error - red
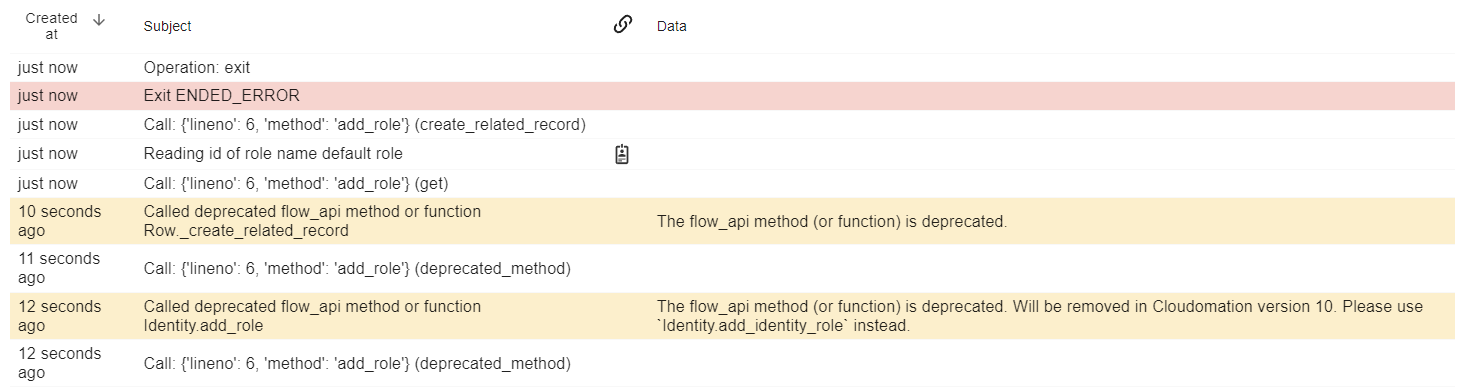
Here you can see all 3 types of log levels.
The Logs Tab
Once you navigate to the logs tab, the information is displayed in a table form.
The "Subject" column is always filled out (e.g.: creating execution) and is searchable. The "Data" column contains additional information if applicable (like input values for creating an execution). Besides displaying information, logs also include links to related resources and activities in the "References" column as seen in the picture below:
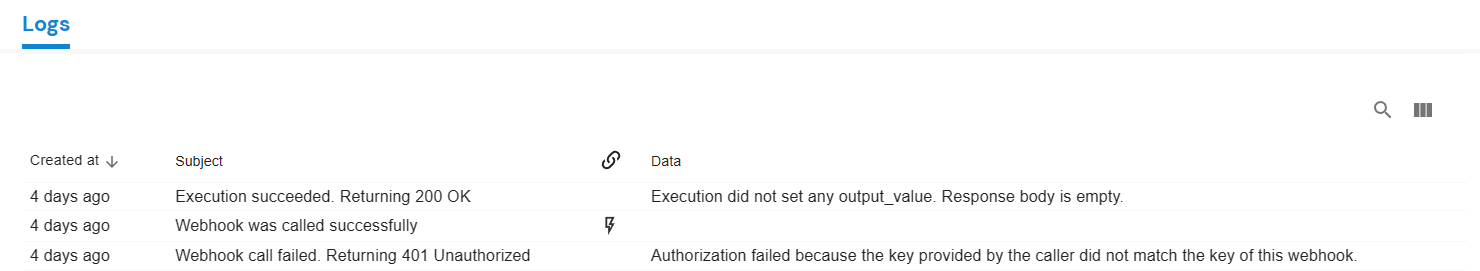
The logs tab of a webhook. Clicking on the lightning symbol opens the execution that called the webhook.
User Logs
Besides logs generated automatically by the system, you can log additional information with the flow_api method this.log().
For this refer to execution methods and look for log.
The subject of logs generated by this.log() is 'user log'. In older versions of Engine, user logs appear on the 'Output' tab not on the 'Logs' tab.
Workspace Logs
If you want to see all logs that were created within your workspace, you can find them under Workspace Logs. For this click on the gear icon and choose "Workspace Logs".

You can access workspace logs through this menu
Logs are displayed similarly to logs on individual resources/activities, with the addition of the column "Record", which is searchable by name or id.
You can filter for logs of a specific type or log level.

The workspace logs

You can filter for specific types

You can filter for specific log levels
Finding Deprecation Notes in Logs
Refer to deprecations for more information.