Logs
Engine collects information provided by various resources and activities about their state changes, operations and more. This information is displayed in the "Logs" tab of the respective resource and collectively under Workspace Logs.
In Engine, the following provide logs:
- Executions
- Git configs
- Roles
- Sync configs
- Users
- Webhooks
- Workspaces
Logs are dynamically updated, so you can follow along even during an execution.
Log Levels
Logs are colour coded so you can easily distinguish between their severity. Here are the different levels and their respective colours:
- Info - no colour
- Warning - yellow
- Error - red
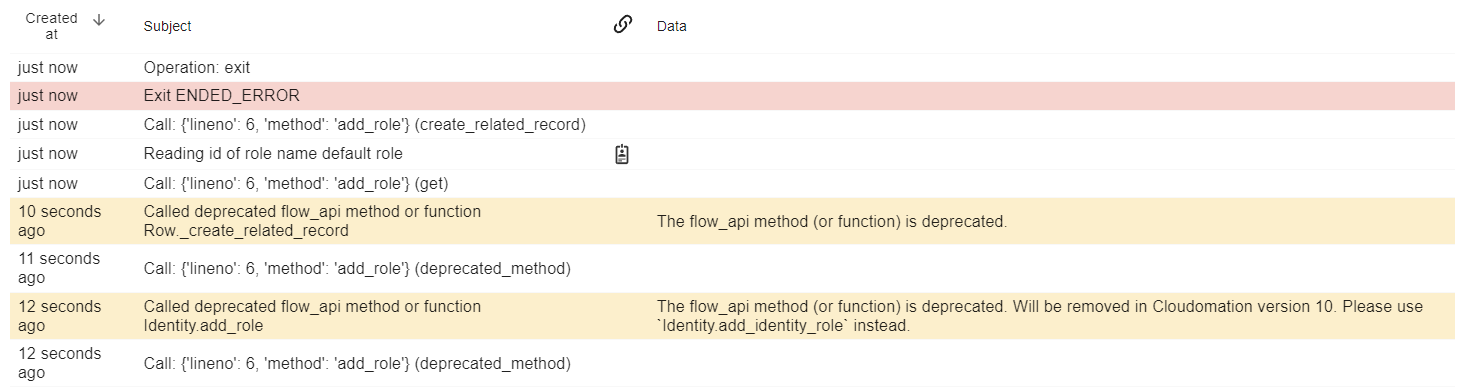
Here you can see all 3 types of log levels.
The Logs Tab
Once you navigate to the logs tab, the information is displayed in a table form.
The "Subject" column is always filled out (e.g.: creating execution) and is searchable. The "Data" column contains additional information if applicable (like input values for creating an execution). Besides displaying information, logs also include links to related resources and activities in the "References" column as seen in the picture below:

The logs tab of a webhook. Clicking on the lightning symbol opens the execution that called the webhook.
User Logs
Besides logs generated automatically by the system, you can log additional information with the flow_api method this.log().
For this refer to execution methods and look for log.
The subject of logs generated by this.log() is 'user log'. In older versions of Engine, user logs appear on the 'Output' tab not on the 'Logs' tab.
Record activity and attribution
Engine records creates, changes, and deletes of records as log entries attributed to the identity that performed them. This covers changes made in the Console, through the REST API, and through the MCP interface, whether the acting identity is a human user or an API key. Each entry captures the operation and the acting identity — not the individual field values — so it does not expose the contents of masked or secret fields.
The activity is visible from two directions:
- On a record's Logs tab: entries such as …was created by…, …was updated by…, and …was deleted by… show who changed the record and its history.
- On a user's Logs tab: the reverse view of everything that identity created, changed, or deleted (for example Created Setting…, Updated Custom Object…, Deleted Flow…), so you can review a single identity's activity across the workspace.
Both views use the same searchable table as other logs, and the complete set is available under Workspace Logs, searchable by record name or id and filterable by type and log level.
Changes made by a running flow through the flow_api are attributed to the execution that performed them.
Role and permission changes
Changes to access control are recorded the same way, so an administrator can review who changed what:
- Granting or revoking a role (assigning a role to an identity, or removing it) writes an entry to the affected role's Logs tab (Role "…" granted/revoked to identity … by …) and, from the other direction, to the affected identity's Logs tab, so a user's log shows the roles they gained or lost and who changed them.
- Changing a role's permissions (adding, modifying, or removing a
role_permission) writes an entry to the role's Logs tab. The entry summarises the permission scope inline — its effect (ALLOW or DENY), operation, table or object template, and project — and a modification shows the scope before → after, so a permission narrowing or a newly added deny is legible at a glance.
These entries follow the same attribution rules as other record activity: they capture changes made through the Console, REST API, and MCP interface by human users and API keys, and record the operation and acting identity rather than exposing field values.
To keep the attribution trail focused on durable content, some high-churn record types are excluded by default — namely executions and messages, which are created in large volumes by everyday API and agent activity. The excluded set is configured by the GENERAL_API_AUDIT_EXCLUDED_TYPES workspace setting (under Logging): set it to an empty list to attribute every external write, or add further record types to exclude more.
Log retention and archival
Engine periodically removes expired log entries so the log tables do not grow without bound. Retention is controlled by the LOGGING_EXPIRY_* settings (under Logging in the workspace configuration options): entries older than the configured retention window are pruned in the background. The bulk of log volume — record_log and record_log_record — is stored in daily partitions, so retention drops whole expired day-partitions rather than deleting rows one by one.
Dropping an expired partition permanently deletes the log data it holds. When you want that data to age into durable cold storage instead of being deleted, enable log archival: each expiring daily partition is exported to a file before it is dropped.
Archival is controlled by three Logging settings:
| Setting | Purpose |
|---|---|
LOGGING_ARCHIVE_ENABLED | Turns archival on. Off by default. When on, an expiring record_log/record_log_record day-partition is exported before it is dropped. |
LOGGING_ARCHIVE_DIRECTORY | A filesystem directory inside the workspace container where the exported files are written. Use a path on a persisted mount (for example a subdirectory of the shared /data volume) so the files survive container restarts. |
LOGGING_ARCHIVE_POST_EXPORT_FLOW | The name of a flow started after each successful export. It owns the exported file from that point on. |
Each partition is exported as a gzipped CSV file at:
<LOGGING_ARCHIVE_DIRECTORY>/<table>/<workspace_id>/<YYYY-MM-DD>.csv.gz
where <table> is record_log or record_log_record and <YYYY-MM-DD> is the partition's day. The file is written to a temporary sibling and atomically renamed on completion, so a partial file is never mistaken for a complete archive.
After a partition is exported, the configured post-export flow is started with this input:
{
  "file_path": "<path to the exported .csv.gz>",
  "table": "record_log",
  "day": "2026-09-01"
}
The flow is responsible for the file's onward lifecycle — for example, uploading it to object storage and then deleting the local copy. Engine itself does not upload the file anywhere and does not prune the archive directory; that is the flow's job.
A partition is dropped only after its export succeeds. If the export fails, the partition is kept and an error is logged, and the export is retried on the next retention cycle. If LOGGING_ARCHIVE_ENABLED is on but LOGGING_ARCHIVE_DIRECTORY or LOGGING_ARCHIVE_POST_EXPORT_FLOW is not set, the partition-drop pass is skipped entirely and the misconfiguration is logged — retention never deletes log data that you asked to archive first.
Project and Bundle Logs
Projects and bundles have a dedicated Logs node in the left-hand menu. It aggregates the logs of all resources contained in that project or bundle, so you can review the activity of an entire project or bundle in one place without opening each contained resource individually.
Project and bundle logs are displayed in the same table form as other logs — including the searchable "Record" column — and can be filtered by type and log level.
Workspace Logs
If you want to see all logs that were created within your workspace, you can find them under Workspace Logs. For this click on the gear icon and choose "Workspace Logs".

You can access workspace logs through this menu
Logs are displayed similarly to logs on individual resources/activities, with the addition of the column "Record", which is searchable by name or id.
You can filter for logs of a specific type or log level.

The workspace logs

You can filter for specific types

You can filter for specific log levels
Finding Deprecation Notes in Logs
Refer to deprecations for more information.