Execution Live Monitor
The execution live monitor displays past or present executions. It gives you an overview of what's happening in your Workspace.
It is a great way to:
- Monitor the progress of your processes.
- See the status of executions to identify errors quickly.
- Find specific executions with the help of filtering and search.
Together with the Dependency Visualisation and Script Visualisation, it enables monitoring and operating automations in a visual way, without the need for scripting.
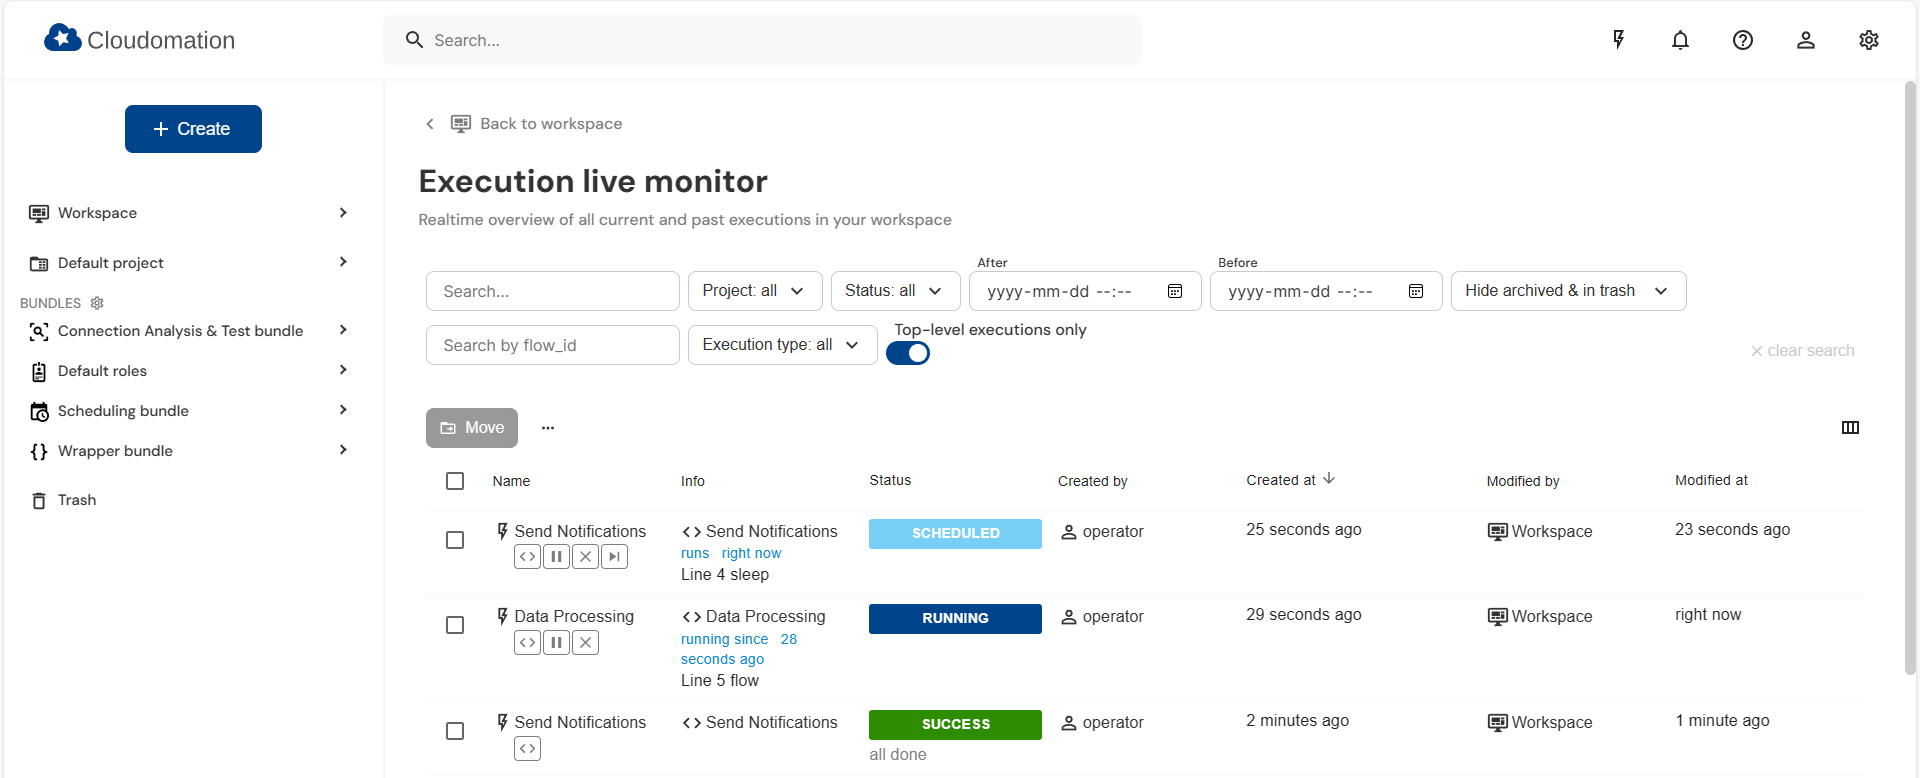
The execution live monitor
Concept
The execution live monitor can be opened by pressing the lightning bolt icon in the top-bar of the Engine user interface:
![]()
The execution live monitor button
The table shows all your executions, the most recently created execution is on top of the list.
The execution live monitor will update automatically. When new executions are created or running executions change status, the screen will update to show the changes.
Filters and search
You have a variety of filter and search options to limit the executions which are displayed and quickly find exactly what you need.

The bar for filters and search
Name search
When set, only executions whose name contains the given search term will be shown. Searching is case-insensitive. The search term can consist of strings (words) separated by spaces. If you wrap your search term with double quotation marks it will be handled a single unit. See how this affects searching in the example below.
Let's say there are 3 executions in total. Their names are:
- Send Notifications
- Send mail Notifications
- Data Processing
Without any filter set, you can see them all. The following search terms will yield the following results:
send no: gives you executions 1 and 2 since their names includesendandno"send no": gives you only execution 1 since the search term is wrapped with quotation markssend mail: gives you only execution 2
Project filter
When set, only executions associated with any of the checked projects will be shown.
Status filter
When set, only executions in any of the checked status will be shown.
Time range
When set, only executions which were created within the time range specified by "After" and "Before" will be shown.
Show/Hide archived & in trash
Whether to show trashed or archived executions.
Flow ID search
When set, only executions that were started by a flow with the specified ID will be shown.
Execution Types
When set, only executions with the checked type will be shown.
Top-level executions
This toggle button help maintaining a good overview even in the case of complex processes with many executions.
Let's say you run a flow in the UI that starts ex A. ex A starts another two exs ex B and ex C. They each start one
more ex ex D and ex E respectively.
Since ex A is the one at the start of the process, it is the top-level execution.
Actions
In the Execution Live Monitor, you have access to a set of actions: Move, Delete, Pause, Cancel, and Resume.
These actions can be applied either to the entire process or to a specific execution instance.
To access the actions available for a specific execution, click the "..." icon located on the right-hand side of the Actions section.

The execution live monitor actions
When actions are applied to the overall process rather than to specific executions, they affect both the current execution and all of its child executions.
When "Move process to trash" action is taken for an execution of the below flow, the execution of the flow another_flow is also moved to trash.
import flow_api
import time

def handler(system: flow_api.System, this: flow_api.Execution, inputs: dict):
    this.flow(
        'another_flow',
        run=False
    )
 time.sleep(10) # optional in order to observe the behaviour
    return this.success('All done.')