Dependency Visualization
The dependency visualization shows how the executions in a process relate to one another. It renders two kinds of relationship in a single graph:
- Child executions — the create-time spawn tree: an execution and the executions it started, walking
parent_execution_id. - Dependencies — the wait/ordering graph: an execution that paused and waited for the result or completion of another execution (for example
this.dependency(...), or anywait=Truecall).
An execution pair can be related by only one kind or by both — a flow that waits on a child it spawned is related both ways. Each edge is coloured by its kind; see Relationship kinds.
The dependency visualization is not to be confused with script visualization. While the former displays whole processes, the latter displays the details of individual executions.
Concept
Engine extracts hierarchy information of dependent executions during runtime and dynamically creates a graph view that is displayed on the UI of said executions.
Each execution shows all of its children but only its direct parent in the dependency visualization. If you want to see the tree view of the whole process you need to view it on the execution that started the process.
The dependency disualization provides insight into execution dependencies, showing which execution is waiting or has waited for another. It is designed to help you understand the order and coordination of execution flows.
Key Behavior
- Shows both the spawn tree (child executions) and the dependency graph reachable from the currently opened execution.
- Includes one level "up" (the parent execution, and any dependee executions).
- Includes all levels "down" (child executions and dependent executions), up to a total limit (default: 500 executions). This limit is configurable via the Workspace Configuration. Please refer to the
VISUALIZATION_MAX_NODESoption in User Interface for configuration.
Displays:
- The status of all included executions.
- The type and name of all included executions.
- Iterations, as long as the execution explicitly creates a dependency for them.
A child execution appears as soon as it is spawned — as a Child execution edge — even before its parent waits for it, because it is part of the spawn tree (it carries the parent's parent_execution_id).
Once the parent establishes a dependency on that child (for example this.dependency(*children), or a wait=True call), the edge is shown as Child & dependency.
A child that is fully detached from its parent (started with orphan=True, so it carries no parent_execution_id) is not part of the spawn tree and only appears once a dependency to it exists.
The UI
The tree view
Since the visualization is generated at runtime you can follow along a process and get live updates on the status of each execution in the hierarchy. The status of the executions is color coded:
- Green: success
- Dark blue: running
- Light blue: waiting
- Yellow: paused
- Red: error
Nodes for executions that no longer exist normally are also styled distinctly, so the shape of the process stays readable even as executions are cleaned up:
- Trashed executions (an execution that has been moved to the trash) are shown muted, with a dashed border — still visible in the tree, but clearly not a live node.
- When a node is permanently removed from the process it fades out instead of disappearing abruptly, and its connecting edges are muted.
Now imagine a simple process: getting information from a weather station and if the connection to the station fails connect to a backup weather station. This process will demonstrate how the dependency visualization is displayed during runtime.
Each node in the tree view is clickable and will lead you to the execution that it represents.
Starting the process

Initially, only the starting execution shows. The color signals that it's currently running.
The first child executions appear
The connection to the primary weather station failed so the backup process has been started.
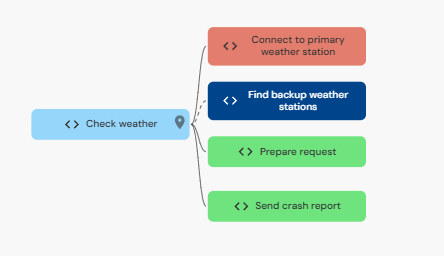
The parent "Check weather" is now waiting on "Find backup weather station".
Going down a level further
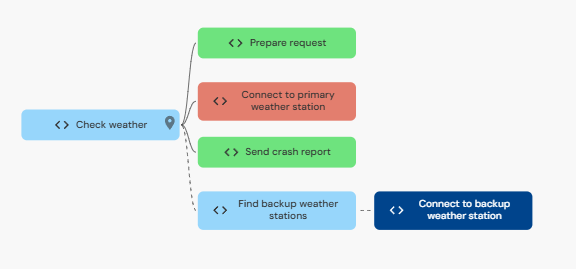
The execution "Find backup weather station" has started another child.
A short interlude
Let's halt the execution "Find backup weather station" for a brief moment before continuing.
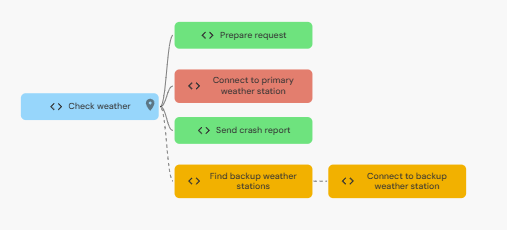
Yellow is the color of pause. Note the the child of the paused execution is also paused.
The process is complete
After resuming the execution the process runs to completion.
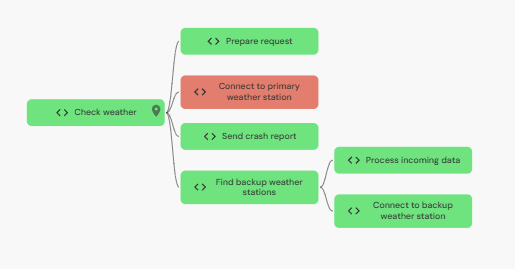
The final execution tree.
Relationship kinds
The graph colours each edge by the kind of relationship it represents. A legend in the top-right corner of the visualization lists the kinds present in the current graph:
| Colour | Label | Meaning |
|---|---|---|
| Blue | Child execution | A spawn-tree edge — the parent execution started (spawned) the child execution (parent_execution_id). |
| Yellow | Dependency | A wait/ordering edge — one execution waited for the result or completion of another. |
| Green | Child & dependency | The pair is related both ways: an execution spawned another and also waited for it — the common case for a flow that awaits a child it started. |
The legend only lists the kinds that actually occur in the graph you are viewing.
Edge colour encodes the relationship kind; node colour encodes execution status (see the tree view above). The two are independent — a green node is a succeeded execution, while a green edge is a "child & dependency" relationship.
The Children tab
The Children tab on an execution screen lists the same set of related executions as a table. Its Relation column tags each row with the same colours and labels as the graph legend — Child execution, Dependency, or Child & dependency — so you can read the relationship kind without opening the graph.
By default the tab shows the full set of dependency descendants — every execution reachable through the process's dependency graph, the same set drawn by the dependency visualization. An All descendants toggle at the top of the tab controls the scope: leave it on (the default) to see the whole descendant subtree, or turn it off to narrow the table to only the direct child executions the current execution spawned itself (parent_execution_id).
Each row's Relation reflects how that execution relates to the rest of the process (its own incoming relationship). A dash (—) means the execution has no such relationship within the graph — for example the root execution you are currently viewing.
The Relation column is derived from the same visualization graph, so it is subject to the same VISUALIZATION_MAX_NODES limit. In a process with more executions than the limit, rows that fall outside the rendered graph show a dash even when they are genuine children.
Flat and tree views
A Tree view toggle in the tab controls switches how the descendants are laid out:
- Flat view (the default) is the table described above: one row per execution with the full column set, column picker, sorting and pagination.
- Tree view renders the descendants as an expandable, collapsible hierarchy. Nodes are nested along the spawn tree — each execution appears under the execution that started it (
parent_execution_id) — so the parent → child → grandchild structure is browsable inline without opening the graph. Executions whose parent is outside the loaded set are shown as top-level nodes.
Each tree node carries a caret to expand or collapse its subtree and a badge with the number of descendants beneath it; Expand all and Collapse all controls open or close the whole tree at once. Every node keeps its Relation tag (Child execution, Dependency, or Child & dependency), so the dependency-graph relationship stays visible even though the nesting itself follows the spawn tree.
Tree view focuses on the Name, Status and Relation columns to keep the hierarchy readable; use the flat view when you need the other columns, sorting or pagination. To render a complete hierarchy the tree loads the full descendant set up to the same node limit as the visualization; if a process exceeds that limit, a note indicates that the tree is truncated.
Other elements
Orientation and size
Some processes are better displayed horizontally, some vertically, hence you can toggle the orientation. It's also possible to fit the visualization to the window size.

The fit to screen button (above) and the toggle button (below).
Here's how the previous process would look with a different orientation:
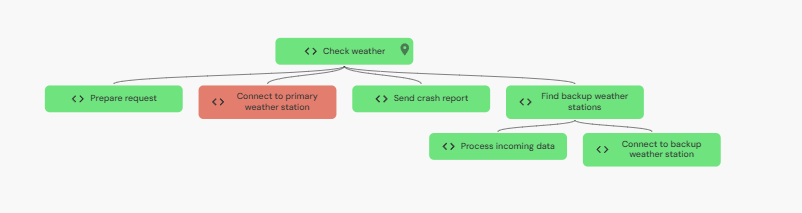
The toggled orientation
Related resources
Engine also displays flows, connectors and other resources that are used in the process.
You can click on a related resource to highlight which steps of the process use that resource.
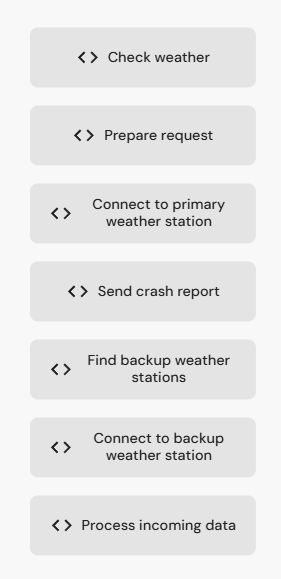
The related resources.